Parliamentary Elections in Moldova | 2014 | 2010 | July 29, 2009 | April 5, 2009 | 2005 | 2001 | 1998 | 1994
ADEPT | Gagauzia 2016 | Presidential 2016 | Elections 2015 | Bashkan 2015 | Gagauzia 2012 | Political Parties
Statistical analysis of the lists of electoral contestants
Number of candidates | ||||||||||||||||||||||
| Total | ||||||||||||||||||||||
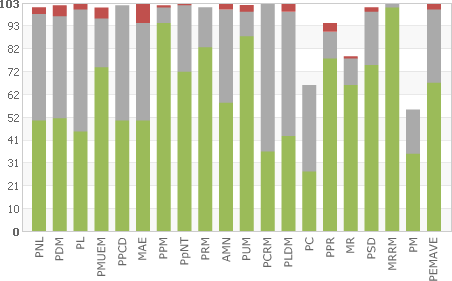
| Total number on the list | 101 | 102 | 103 | 101 | 102 | 103 | 102 | 103 | 101 | 103 | 102 | 103 | 103 | 66 | 94 | 79 | 101 | 103 | 55 | 103 | 1930 | |
|---|---|---|---|---|---|---|---|---|---|---|---|---|---|---|---|---|---|---|---|---|---|---|
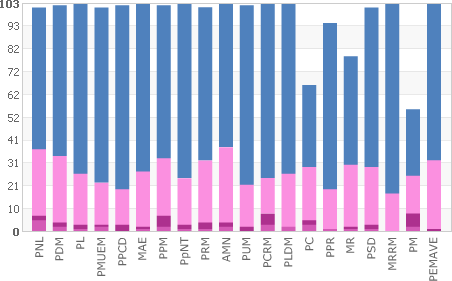
| Women | 37 | 34 | 26 | 22 | 19 | 27 | 33 | 24 | 32 | 38 | 21 | 24 | 26 | 29 | 19 | 30 | 29 | 17 | 25 | 32 | 544 28.19% | |
| 1–10 places | 5 | 2 | 1 | 2 | 0 | 1 | 2 | 1 | 1 | 2 | 0 | 3 | 2 | 3 | 1 | 1 | 1 | 0 | 2 | 0 | 30 15.00% | |
| 11–20 places | 2 | 2 | 2 | 1 | 3 | 1 | 5 | 2 | 3 | 2 | 2 | 5 | 0 | 2 | 0 | 1 | 2 | 0 | 6 | 1 | 42 21.00% | |
| Total — top 20 places on the list | 7 | 4 | 3 | 3 | 3 | 2 | 7 | 3 | 4 | 4 | 2 | 8 | 2 | 5 | 1 | 2 | 3 | 0 | 8 | 1 | 72 18.00% | |
| Men | 64 | 68 | 77 | 79 | 83 | 76 | 69 | 79 | 69 | 65 | 81 | 79 | 77 | 37 | 75 | 49 | 72 | 86 | 30 | 71 | 1386 71.81% | |
 | ||||||||||||||||||||||
Age of candidates | ||||||||||||||||||||||
| Total | ||||||||||||||||||||||
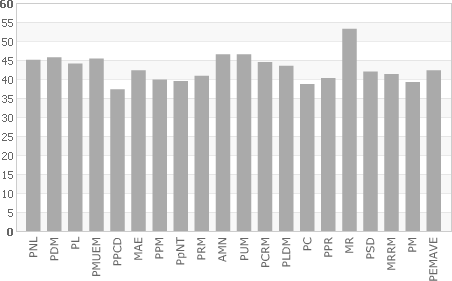
| Average age | 45.1 | 45.7 | 44.1 | 45.4 | 37.3 | 42.3 | 39.9 | 39.5 | 40.9 | 46.5 | 46.5 | 44.5 | 43.5 | 38.7 | 40.3 | 53.2 | 42.0 | 41.3 | 39.2 | 42.3 | 42.9 | |
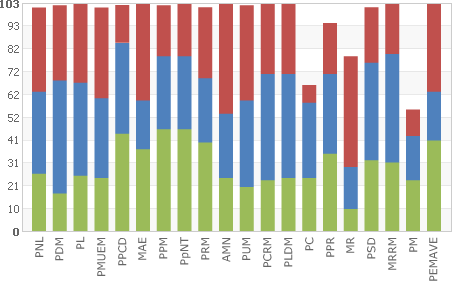
| Before 35 years of age | 26 | 17 | 25 | 24 | 44 | 37 | 46 | 46 | 40 | 24 | 20 | 23 | 24 | 24 | 35 | 10 | 32 | 31 | 23 | 41 | 592 30.67% | |
| Between 36–50 years of age | 37 | 51 | 42 | 36 | 41 | 22 | 33 | 33 | 29 | 29 | 39 | 48 | 47 | 34 | 36 | 19 | 44 | 49 | 20 | 22 | 711 36.84% | |
| After 51 years of age | 38 | 34 | 36 | 41 | 17 | 44 | 23 | 24 | 32 | 50 | 43 | 32 | 32 | 8 | 23 | 50 | 25 | 23 | 12 | 40 | 627 32.49% | |
 |  | |||||||||||||||||||||
Social status of candidates | ||||||||||||||||||||||
| Total | ||||||||||||||||||||||
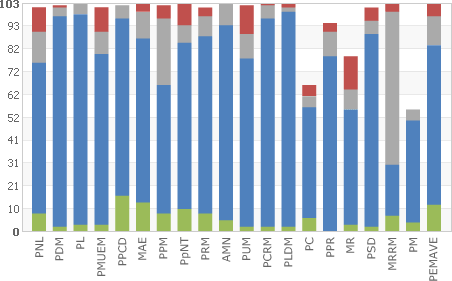
| Students | 8 | 2 | 3 | 3 | 16 | 13 | 8 | 10 | 8 | 5 | 2 | 2 | 2 | 6 | 0 | 3 | 2 | 7 | 4 | 12 | 116 6.01% | |
| Employees | 68 | 95 | 95 | 77 | 80 | 74 | 58 | 75 | 80 | 88 | 76 | 94 | 97 | 50 | 79 | 52 | 87 | 23 | 46 | 72 | 1466 75.96% | |
| Unemployed | 14 | 4 | 5 | 10 | 6 | 12 | 30 | 8 | 9 | 10 | 11 | 6 | 2 | 5 | 11 | 9 | 6 | 69 | 5 | 13 | 245 12.69% | |
| Pensioners | 11 | 1 | 0 | 11 | 0 | 4 | 6 | 10 | 4 | 0 | 13 | 1 | 2 | 5 | 4 | 15 | 6 | 4 | 0 | 6 | 103 5.34% | |
 | ||||||||||||||||||||||
Participation of candidates on the lists in current and previous elections | ||||||||||||||||||||||
| Total | ||||||||||||||||||||||
| First appearance on the list | 50 | 51 | 45 | 74 | 50 | 50 | 94 | 72 | 83 | 58 | 88 | 36 | 43 | 27 | 78 | 66 | 75 | 101 | 35 | 67 | 1243 64.40% | |
| Participation on the lists of more than 2 parties | 3 | 5 | 3 | 5 | 0 | 9 | 1 | 1 | 0 | 3 | 3 | 0 | 4 | 0 | 4 | 1 | 2 | 0 | 0 | 3 | 47 2.44% | |
 | ||||||||||||||||||||||