ADEPT | Gagauzia 2016 | Presidential 2016 | Elections 2015 | Bashkan 2015 | Gagauzia 2012 | Political Parties
Evolution of European option in Moldova (2000–2007)
 |
| |
|
This approach reveals the evolution of European option in Moldova from August 2000 to May 2007, establishes the profile of “Europtimistic” group of people and the hierarchy of criteria that divide the public opinion concerning the European integration. In this respect, the approach is based on Barometers of Public Opinion (BPOs) commissioned by the Institute of Public Policy (IPP). These surveys were the basis of the analysis for at least three reasons:
- BPOs measure the adherence to the European idea in Moldova;
- BPOs are conducted systematically, allowing to identify the evolution of public opinion regarding the European integration;
- BPOs are relatively complex, detailed and objective.
Fourteen BPOs have been conducted until now. The first BPO was conducted in August 2000, and the last one was launched in May 2007. Two BPOs have been conducted every year between these two dates. Every BPO is conducted on a sample of at least 1,000 respondents; it is representative for the adult population of Moldova, except for Transnistria, and has a maximum error margin of 3 percent.
BPOs contain two basic questions aimed to measure the evolution of European option in Moldova in 2000–2007. They are: “How do you think, what is the path our country should follow?” (BPOs conducted from August 2000 to May 2004) and “Would on next Sunday a referendum on Moldova’s accession to E.U. take place, how would you vote?” (BPOs conducted from April 2003 to May 2007). Two diagrams have been built on basis of answers to the two questions.
Diagram 1
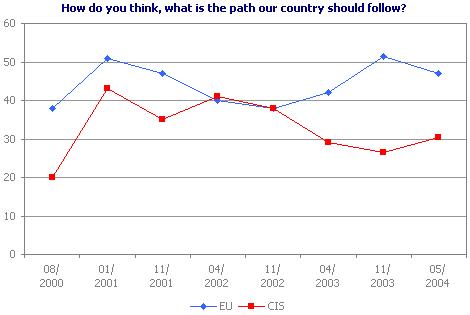
Diagram 1 indicates the distribution of answers for two options from BPOs conducted from August 2000 to May 2004: (1) “Integration within the E.U.” and (2) “Integration/ Stay within the CIS”. If the August 2000 BPO is taken as a reference point, the number of respondents who opted for Moldova’s integration within the E.U. has grown by 8.9 percentage points from August 2000 to May 2004. At the same, it is worth to note that the “Integration within the CIS and within the E.U.” was a compromise option in the August 2000 BPO, and 32 percent of respondents have chosen it. If this option were missing like in the other BPOs by May 2004, then the separate numbers of those favouring the “Integration within the EU.” or the “Integration/ Stay within the CIS” would be probably higher. Starting with the January 2001 BPO, the number of respondents who chose one of the two options from Diagram 1 was separately quantified, without offering the compromise option from the August 2000 BPO. The January 2001 BPO is a better reference point to measure the evolution of European option than the August 2000 BPO, as the same questionnaires were used from January 2001 to May 2004.
Table 1 below is complementary to Diagram 1 and features the correlation “Power — Foreign Policy Options” including the option for integration within the E.U., for August 2000 — May 2004.
Table 1. How do you think, what is the path our country should follow?
| Authorities/ Options | 08/2000 | 01/2001 | 11/2001 | 04/2002 | 11/2002 | 04/2003[1] | 11/2003 | 05/2004 |
|---|---|---|---|---|---|---|---|---|
| Government | Braghis | Braghis | Tarlev | Tarlev | Tarlev | Tarlev | Tarlev | Tarlev |
| Parliament | ADR-PPCD | ADR-PPCD | PCRM | PCRM | PCRM | PCRM | PCRM | PCRM |
| President | Lucinschi | Lucinschi | Voronin | Voronin | Voronin | Voronin | Voronin | Voronin |
| E.U. | 38 | 51 | 47 | 40 | 38 | 42 | 51,3 | 46,9 |
| CIS | 20 | 43 | 35 | 41 | 38 | 29 | 26,6 | 30,4 |
Starting from more relevance of findings of the January 2001 BPO for measuring the evolution of European option, the number of persons who opted for the E.U. in January 2001 (3rd column from Table 1: Braghis Government, parliamentary majority of ADR without PPCD and President — Petru Lucinschi) has declined by 4.1 percent until May 2004 (last column: Tarlev I Government, parliamentary majority of PCRM and President — Vladimir Voronin). For comparison, the number of respondents who opted for the CIS in the same period has decreased by 12.6 percent.
Although the May 2004 BPO was the last one to include the question on Moldova’s foreign orientation, the adhesion to the European idea may be also observed on basis of the question if respondents would vote “For” or “Against” at an eventual referendum on Moldova’s accession to the E.U. This question is included for the first time in the April 2003 BPO and it is part of BPOs conducted till May 2007, except for the February 2005 barometer.
Diagram 2 below was built on basis of answers to this question.
Diagram 2
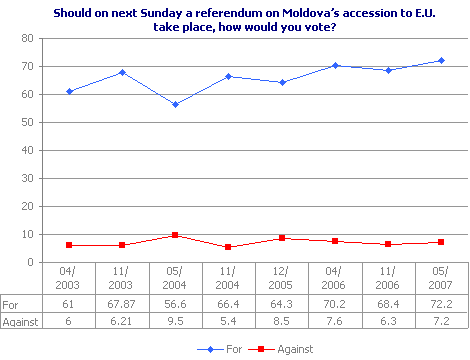
Diagram 2 indicates the distribution of answers for two options included in barometer surveys conducted from April 2003 to May 2007: (1) “For” and (2) “Against”. The diagram shows that the number of people who would vote “For” at an eventual referendum on Moldova’s accession to the E.U. has grown by 11.2 percentage points from April 2003 to May 2007. At the same time, the number of people who would vote “Against” has grown by 1.2 percent. The number of respondents who chose “For” has grown by 7.9 percent and of respondents who would vote “Against” has dropped by 1.3 percent from December 2005 to May 2007, in the period when the E.U.-Moldova Action Plan was being implemented.
The 72.2 percent of respondents who would vote “For” at a referendum on Moldova’s accession to the E.U., according to the May 2007 BPO, reveals a “permissive consensus” in Moldovan society regarding the European integration. The concept was introduced by Lindberg and Scheingold in the realm of European Integration Studies in 1970, in order to explain the public support enjoyed by European integration process at the beginning.
The options from barometer surveys conducted from August 2000 to May 2007 were stratified on following criteria: (1) sex; (2) residential area; (3) age; (4) nationality; (5) education; (6) socioeconomic condition of respondents. Following are the conclusions of an in-depth analysis of findings of barometer surveys conducted in the period concerned:
Although the majority of women are “Europtimistic”, their share is smaller than of men. At the same time, more men than women have opted for “Integration/ Stay within the CIS” in August 2000 — May 2004 and chose “Against” in the surveys conducted from April 2003 to May 2007 regarding an eventual referendum on Moldova’s accession to the E.U. On the other hand, more women than men answered “Don’t know” to both questions from diagrams.
Majority of respondents from urban areas are “Europtimistic”, but their share is lower than in rural areas. More respondents in urban areas voted for the “Integration/ Stay within the CIS” than rural respondents, in BPOs conducted from August 2000 to May 2004, and “Against” in surveys conducted from April 2003 to May 2007. The number of respondents from rural areas who did not know to answer is bigger than of respondents from towns.
The degree of “Europtimism” or “Euroscepticism” of respondents is directly proportional with their age. The answers from BPOs were stratified on following age categories: 18–29; 30–44; 45–59 and 60 years and over. The younger the respondents are the more “Europtimistic” they are. An equal number of respondents from age categories 30–44 and 45–59 years would vote “For” at a referendum on accession to the E.U.
The same sort of proportionality is reversely valid for answers “Integration/ Stay within the CIS” and “Against”. Or, the elder the respondents are, the bigger the number of respondents who chose these answers is.
Hence, it would seem at a first glance that the public support for the European integration would grow concomitantly with the change of generations. Data from Diagram 2 confirm the growth of this support for the time being. However, this hypothesis could be refuted on long term. According to European experience, the more people get elder the less ready they become to support the European building process. Then, once states advance in European integration processes, the “permissive consensus” is gradually eroding.
Moldovans/ Romanians are more “Europtimistic” than representatives of national minorities.[2] Considering data for the entire examined period, August 2000 — May 2007, representatives of Russian minority are more “Europessimistic” than respondents of Ukrainian ethnic. It is interesting that more respondents of Russian ethnic than of Ukrainian ethnic chose “For” in April 2003 — May 2007, when BPOs comprised the question about a referendum on Moldova’s accession to the E.U. Also, Russians would be readier to choose “Against” than Ukrainians would do. The bigger number of Ukrainians than of Russians who did not know to answer explains this fact.
As regards the question about Moldova’s foreign orientation included in BPOs conducted from August 2000 to May 2004, most Moldovans/ Romanians chose the “Integration within the E.U.” while most of Russians and Ukrainians chose the “Integration/ Stay within the CIS”. The situation is changing as regards the answers of representatives of national minorities to the question about referendum on accession to the E.U., according to BPOs conducted from April 2003 to May 2007. The majority of them would vote “For”. Their number is nearly 4-fold higher than of respondents who would vote “Against”.
The degree of adherence to the European idea is directly proportional to the education level of respondents. The more educated they are, the more they back the European integration of Moldova and vice versa.
There is the same kind of direct proportionality for socioeconomic condition of respondents. The better the lives of the interviewed persons are, the more “Europtimistic” they are and the number of those who do not know to answer declines.
Findings for criteria (1), (3), (5) and (6) confirm the trends of E.U. public opinion. Men, younger, more educated people with better living standards support more the European building process.[3]
The profile of “Europtimistic” group of people for August 2000 — May 2007 may be established after an in-depth analysis of BPO findings. If the number of all “Europtimists” in Moldova were to be reduced to 100 persons, the profile of this category would be as follows: 52 persons would be men, compared with 48 women; 54 persons would be from villages, compared with 46 from towns; 30 persons would have ages between 18 and 29 years, 27 people between 30 and 44 years, 26 — between 45 and 59 years, and 17 persons would be elder than 60 years; 45 persons would be Moldovans/ Romanians, compared with 55 representatives of national minorities; 30 persons would have higher education, 28 persons would be graduates from high schools or post-lycee schools, 24 people would be graduates from secondary or professional schools, and 18 respondents would have incomplete secondary education.[4]
An analysis of BPO findings also allows a hierarchy of criteria that divide the public opinion concerning the European integration. Following is the hierarchy for August 2000 — May 2007: (1) Education; (2) Age; (3) Nationality; (4) Residential area; (5) Sex.
Differences in education of respondents divide most the public opinion regarding the European integration opportunity of Moldova, while the different genders induce the smallest difference between options of respondents for European idea.
This hierarchy reveals that authorities should focus on following categories while trying to popularise the European idea in Moldova: (1) less educated persons; (2) elderly; (3) representatives of national minorities. These categories should be taken into account in the process of implementation of the Strategy on information and communication for European integration of Moldova.[5] At the same time, urban population should learn more from “Europtimism” of rural people. And not the last, men and women should learn from each other. More communication is welcome for this purpose.
- ↑ A multiple answer was available for the question from this BPO.
- ↑ Only answers of representatives of Russian and Ukrainian minorities were analysed. Answers of representatives of other national minorities are absent in all BPOs.
- ↑ Hix, S. (2005), The Political System of the European Union, 2nd, Basingstoke, Macmillan.
- ↑ The socioeconomic condition of “Europtimistic” persons was not indicated when their profile was established because this criterion is not present in all BPOs.
- ↑ MAEIE (2007), Strategy on information and communication for European integration of Moldova (Draft)RO, website of MFAEI