ADEPT | Gagauzia 2016 | Presidential 2016 | Elections 2015 | Bashkan 2015 | Gagauzia 2012 | Political Parties
What does sociological profile of new local power suggest?
 |
| |
|
General observations
Leaders of political parties have noted before and after the June 2007 general local elections that the good results of those elections are a guarantee of success at the March 2009 parliamentary elections. Indeed, preparations for the 2009 elections have surprisingly started immediately after the new local administration was created. These early preparations began in July, when propagandistic media campaigns were launched at highest rotations, accompanied by strengthening of some media holdings and spectacular inversions of situation inside the electronic media watchdog CCA; ruining of post-electoral democratic alliances before they begin their work because of distribution of influent posts; splitting of the only party with a certain political and electoral history which grew at the recent elections; launching of some novel political projects and initiatives; launching of talks on how future alliances should look like, they should be based on doctrines, offers and messages in order to get rid of the impasse and promote the “change”, etc.
These developments express the fact that the nine electoral campaigns held in the Republic of Moldova after declaration of independence created the stereotype of basic components of electoral success: a) image of leader; b) attractive electoral offer (lure for electors); c) competent and motivated staffs; d) ramified territorial structures; e) support of mass media; f) financial resources to introduce and keep functioning the whole party mechanism. Like everywhere, each of these factors has a different weight for Moldovan parties and cannot be measured exactly. But some of these factors may be implicitly estimated. Relevant post-electoral sociological statistics besides those on distribution of votes on localities can mark out exactly enough the space of political manoeuvres in which party leaders prepare their electoral strategies for the 2009 parliamentary elections.
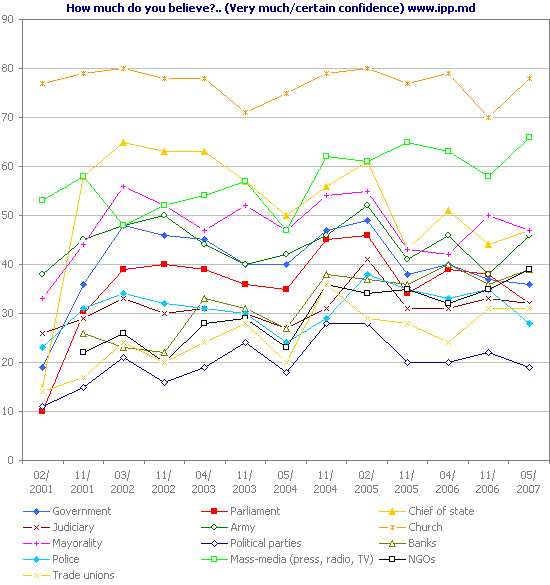
Although surveys conducted the past years constantly revealed that political parties enjoy the lowest confidence among all public and private institutions, they also indicated that local public authorities enjoy the highest confidence (nearly 50 percent) among public institutions, defeating the Parliament, the Government and even the Presidency.
Table 1. How much do you believe?.. (Very much/certain confidence)
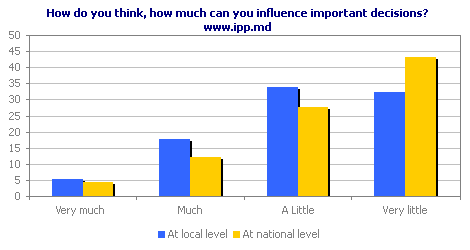
The number of citizens who believe that they can influence the decisions of local authorities is significantly higher that the number of those who are confident that they can easier influence the national decisions.
Table 2. How do you think, how much can you influence important decisions?[1]
These perceptions reveal the importance of territorial branches of parties and their representation in local public administration bodies. That means the poor enough image of parties which may be compensated by a pretty good image of local public administration bodies, of course if parties have an adequate representation in these bodies and if electors appreciate their activity. This is an important factor, with others representing in fact a superstructure, though they sometimes have a bigger influence on electoral success. In this regard, it was not an occurrence when the ruling party has rebuilt the administrative territorial structure of the country accordingly to ramification of its territorial branches.
Sociological profile of mayors
Distribution on political membership criterion
For practical reasons, Table 3 presents the acronyms of political parties in order to compare the data on these parties.
Table 3. Glossary
- DPM — Democratic Party of Moldova
- PCRM — Party of Communists of the Republic of Moldova
- OMA — Our Moldova Alliance
- APM — Agrarian Party of Moldova
- PLJ — Party of Law and Justice
- CDPP — Christian Democratic People’s Party
- PMSNM — Professionals’ Movement Speranta-Nadezhda of Moldova
- LP — Liberal Party
- SLP — Social Liberal Party
- SDPM — Social Democratic Party of Moldova
- EBPRR — Electoral Bloc “Patria-Rodina — Ravnopravye”
- EPGAM — Ecologic Party Green Alliance of Moldova
- RPP — Republican People’s Party
- CUM — Centrist Union of Moldova
- HPM — Humanist Party of Moldova
- PSDM — Party of Social Democracy of Moldova
- СP — Conservative Party
- NLP — National Liberal Party
- IC — Independent candidates
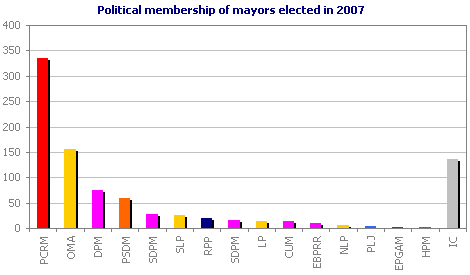
Data on elected mayors represent a distinct interest for comparison of sociological profiles of mayors promoted by parties with those of independent mayors. The number of independent mayors is significant — 135 (15 percent) out of 893 mayors elected on June 3 and 17, 2007 (mayors of 7 localities were not elected for diverse reasons).
Table 4. Political membership of mayors elected in 2007
One may admit that the distribution of independent mayors on various categories — age, gender, education, profession — is adequate to political culture in Moldova. For this reason, the sociological profile may serve as a reference point for comparison with profiles of party mayors.
Distribution on age category
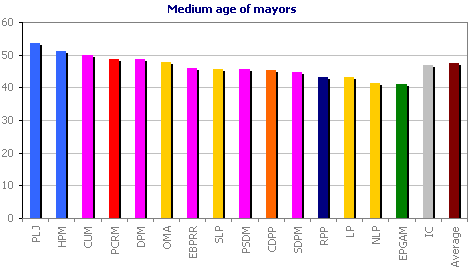
The medium age of mayors is 47.5 years old and independent mayors are a little bit younger — 46.7 years. Of course, this criterion is relevant for influent political parties and that’s why one should not be surprised that the indicators of medium age of mayors representing these parties are flanked by indicators for parties with a minimum representation in Table 5.
Table 5. Medium age of mayors
As regards the representation on age categories inside of parties, the PCRM has the highest representation rate of those aged over 60 and between 50 and 59 years old. Indeed, these are the most active age categories at elections.
Table 6. Distribution of mayors on age categories
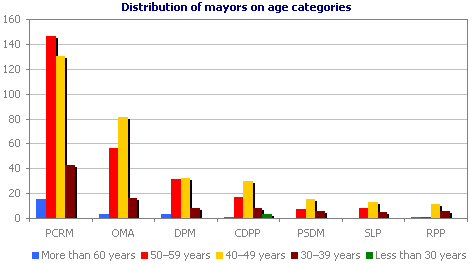
On the other hand, CDPP is the party which promoted most the candidates under 30. Except for PCRM, all other parties confirm a rule, being particularly represented by mayors between 40 and 49 ages.
Distribution on gender criterion
The number of 162 women elected mayors in 2007 is a 2 percent rise compared with the 2003 local elections.
Table 7. Political membership of female mayors
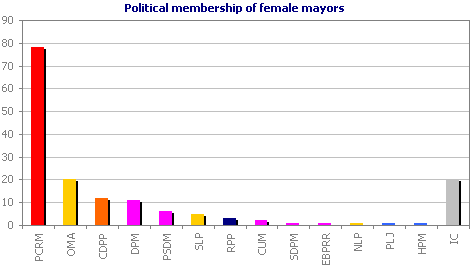
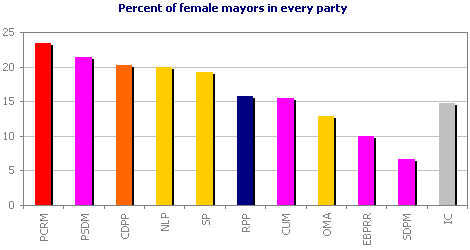
The number of women promoted by some parties significantly exceeds the 18 percent average on country and it is much higher than the representation share of independent female mayors (14.8 percent). It seems that only PCRM, PSDM, CDPP and SLP among big and influent parties have gender policies of representation in elective bodies. Given the fact that 52 percent of Moldovan electors are female and the trend of balancing the representation in elective bodies on gender criteria, these parties could benefit on long term of practices implemented now. OMA alone has a lower representation rate of female mayors among influent parties.
Table 8. Percent of female mayors in every party
Distribution on education criterion
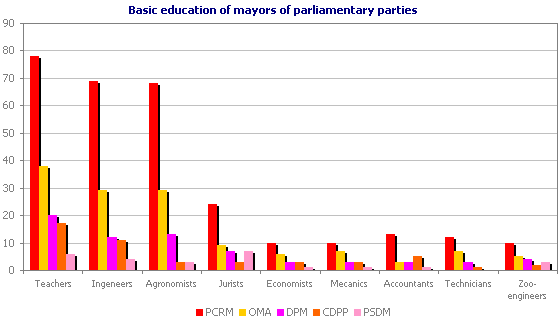
Table 9 reveals that intellectuals and specialists from localities (teachers, engineers, agronomists, lawyers, economists, etc.) who have the best capacity of communication and persuasion are the best represented category for the mayoral office. The proportion and number of specialists educated for socio-economic necessities of localities would rather explain the differences.
Table 9. Distribution of mayors on basic education
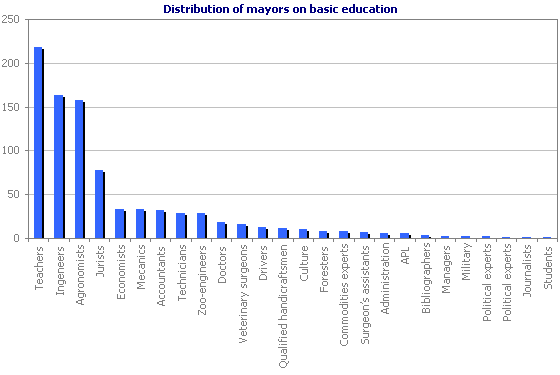
Table 10 reveals that the same representation share after educational criterion is typical to almost all political parties. The observed fluctuations cannot combat this conclusion. This could be the effect of ideological standardisation in the soviet period, when more than 90 percent of the elected mayors had built their personalities.
Table 10. Basic education of mayors of parliamentary parties
Distribution on profession criterion
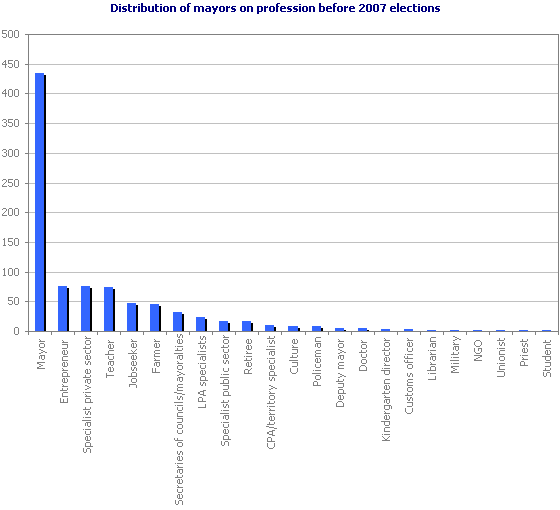
The distribution of mayors on basis of occupation before elections represents a special interest. Table 11 reveals that 435 former mayors (48.3 percent) reconfirmed their competence, being re-elected in this office. This percentage is much higher than the percentage of re-elected parliamentarians and councillors — 30–35 percent.
Table 11. Number of mayors re-elected in 2007
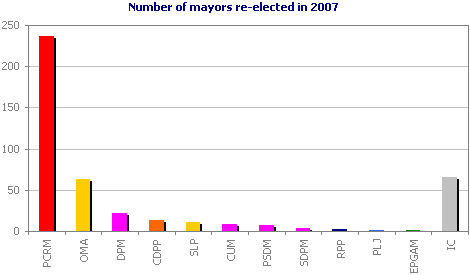
It is worth to note that the entrepreneurship (managers of limited societies, joint stock societies, and individual enterprises) ranks the 2nd place in the top of professions of former mayors. A very high percentage out of 435 mayors elected in 2003 and re-elected in 2007 practice the entrepreneurship. In this respect, it is important to note that all entrepreneurs elected mayors in 2003 had to stop their activities accordingly to legislation, asking their relatives to deal with.
Table 12. Distribution of mayors on profession before 2007 elections
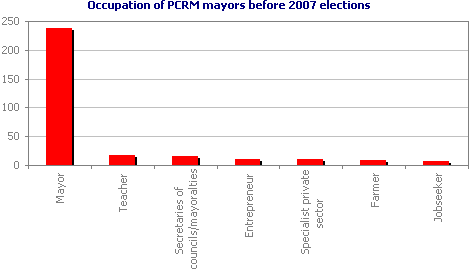
The remarks above are implicitly confirmed if one separately examines the distribution on occupation of mayors representing the PCRM and those elected on behalf of the opposition. Table 13 reveals that former entrepreneurs elected mayors on behalf of PCRM rank the 4th place, being defeated by teachers, who are often headmasters with a great influence on communities, and by secretaries of mayoralties and local councils who are also very influent in localities.
Table 13. Occupation of PCRM mayors before 2007 elections
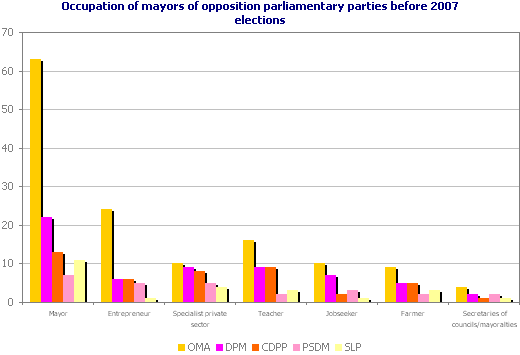
As regards the opposition in general, the category of former entrepreneurs elected mayors leads the top after re-elected mayors. Given these remarks, one may affirm that the distribution of mayors on occupation criterion besides the distribution on education criterion confirm the fact that adherents of main political parties promoted to public offices do not represent distinct social groups with special visions. The doctrinaire membership is a value criterion only for initiative groups which build their parties and elites. Members of parties from territories distributed on social groups have a relatively uniform representation. This conclusion elucidates the 2003 curiosity when the present ruling party declared itself “a party of people”. Really, why not to do it from false modesty if the party does not represent a certain social segment, but has the highest rating and claims to represent everybody?
Table 14. Occupation of mayors of opposition parliamentary parties before 2007 elections
Political migration of mayors
The political migration of mayors is one of remarkable phenomena which confirm that the political membership on the local level is a factor of conjuncture, not of representation of social segments. Thus, 132 out of 435 re-elected mayors or approximately 1/3 changed their political orientation before the recent local elections.
Table 15. Percent of re-elected mayors of every party
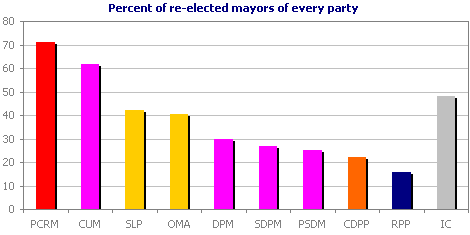
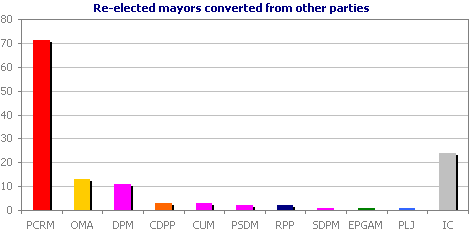
Of course, the ruling party was the best to convert mayors of political opponents (Table 16). PCRM has converted 71 re-elected mayors (30 percent), of them only 27 (11.2 percent) former independents.
Table 16. Re-elected mayors converted from other parties
Democratic parties have also attracted mayors of their opponents and they managed altogether to convert 10 communist mayors (Table 17).
Table 17. Re-elected mayors who migrated from one party to another
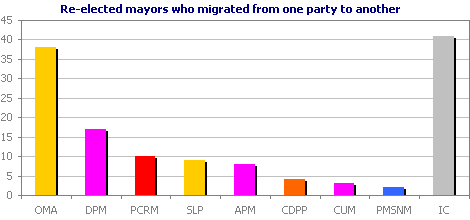
Table 18 provides details about political migration of re-elected mayors. The number of re-elected mayors of every party is indicated on diagonal, at the intersection of horizontal and vertical columns for each party. The number of mayors converted from every opponent party is indicated on horizontal. The number of mayors that every party lost to opponents is indicated on the vertical.
Table 18
| PCRM | OMA | DPM | CDPP | PSDM | SDPM | RPP | CUM | EPGAM | PLJ | IC | SLP | PMSNM | APM | Total | |
|---|---|---|---|---|---|---|---|---|---|---|---|---|---|---|---|
| PCRM | 237 | 21 | 11 | 2 | - | - | - | 2 | - | - | 27 | 2 | 2 | 4 | 71 |
| OMA | 3 | 63 | 2 | - | - | - | - | 1 | - | - | 5 | 2 | - | - | 13 |
| DPM | 1 | 2 | 22 | 1 | - | - | - | - | - | - | 4 | - | - | 3 | 11 |
| CDPP | - | 1 | 1 | 13 | - | - | - | - | - | - | 1 | - | - | - | 3 |
| PSDM | 1 | - | - | - | 7 | - | - | - | - | - | 1 | - | - | - | 2 |
| SDPM | - | - | - | - | - | 3 | - | - | - | - | 1 | - | - | - | 1 |
| RPP | 1 | 1 | - | - | - | - | 3 | - | - | - | - | - | - | - | 2 |
| CUM | 1 | - | - | - | - | - | - | 8 | - | - | 1 | 1 | - | - | 3 |
| EPGAM | - | - | - | - | - | - | - | - | 1 | - | 1 | - | - | - | 1 |
| PLJ | - | 1 | - | - | - | - | - | - | - | 1 | - | - | - | - | 1 |
| IC | 3 | 12 | 3 | 1 | - | - | - | - | - | - | 65 | 4 | - | 1 | 24 |
| SLP | - | - | - | - | - | - | - | - | - | - | - | 11 | - | - | 0 |
| PMSNM | - | - | - | - | - | - | - | - | - | - | - | - | 0 | - | 0 |
| APM | - | - | - | - | - | - | - | - | - | - | - | - | - | 0 | 0 |
| Total | 10 | 38 | 17 | 4 | 0 | 0 | 0 | 3 | 0 | 0 | 41 | 9 | 2 | 8 | 132 |
Sociological profile of district and municipal councillors
There are essential differences between sociological profiles of district and municipal councillors (2nd level of local administration) and mayors of localities elected at the June 3 and 17, 2007 local elections. These differences will be highlighted below, being the expression of particularities of the Law # 436-XVI from 28.12.06 concerning the local public administration and the Law # 768-XIV from 02.02.2000 concerning the status of local councillor, which regulate the competences, responsibilities, incompatibilities and temporary framework of councillors and mayors. Thus, councillors enjoy an extended authority in making decisions and controlling their execution by administration, but their responsibilities are very vague inclusively because of an unstable remuneration (except for daily allowances), having a normal work programme of one sitting in three months. Instead, mayors have managerial responsibilities and their function is incompatible with any other remunerated post, except for teaching or scientific jobs.
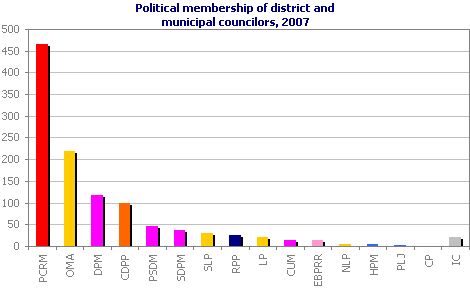
Distribution on political membership criterion
Table 19 reveals that the councillor position is politicised more than the mayoral office. Thus, only 1.9 percent of the elected district and municipal councillors attended the elections as independent candidates, compared with 15 percent of mayors. Also, the mayoral office was wanted more than the councillor position — more than 9 persons bided for the post of mayor and more than 5 persons for the office of councillor. The distribution of the 1,122 district and municipal councillors on political membership criterion generally repeats the distribution of mayors.
Table 19. Political membership of district and municipal councilors, 2007
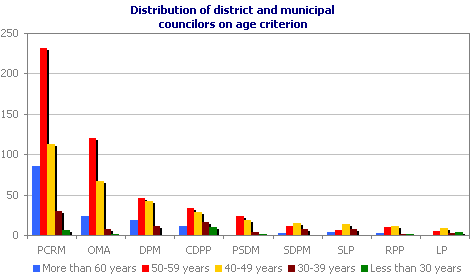
Distribution on age criterion
The medium age of district councillors is 51.7 years old, by four years more than of mayors. Table 20 reveals that the PCRM and the LP are at the poles of the age average of councillors among parties with a certain weight.
Table 20. Medium age of district and municipal councilors, 2007
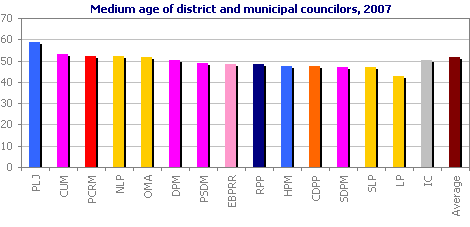
Table 21 shows that proportions of age categories of the main political parties are comparable. In contrast with the distribution of mayors, the distribution of councillors on age criterion is more balanced. There is an explanation in this respect: the councillors are elected on party lists, being represented those inserted in top of candidates lists, while as regards mayors the representation of different categories rests at a bigger extend with sympathies of citizens for skills of candidates and less with representation norms accepted by parties. Table 21 reveals that the LP and the CDPP are the parties with the most balanced representation on age criterion, while the PCRM, the OMA and the DPM promote the most experienced persons.
Table 21. Distribution of district and municipal councilors on age criterion
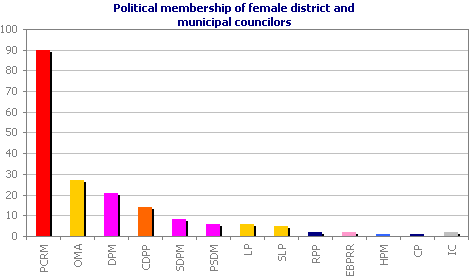
Distribution on gender criterion
As many as 16.5 percent of the district and municipal councillors are female, which is by 1.5 percent less than female mayors. The percent of independent female councillors — 0.2 percent — confirms that Moldovan parties have an important role in promoting equal genders in politics. Table 22 highlights the numeric representation of female councillors in political parties.
Table 22. Political membership of female district and municipal councilors
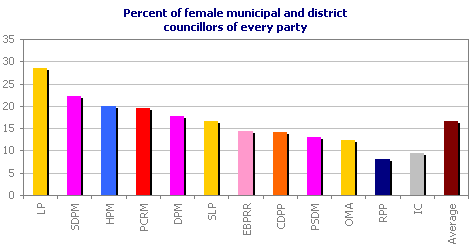
In general, the representation of women in Parliament — 20 percent, mayoralties 18 percent and district and municipal councils 16.5 percent accordingly to the European average is the merit of parties. Although there are clear progresses in promoting women, one cannot speak so far about well-done policies in this respect. The representation of female councillors in the two municipalities with status of administrative territorial units of second level, Balti and Chisinau, is cardinally different. The representation of female councillors in Balti is 14.3 percent, which means below the average on country, while the representation of female councillors in the Chisinau municipality is the highest — 1/3. The performance in Chisinau is due to the second faction in the Chisinau Municipal Council, the Liberal Party, which is represented more than 50 percent by women. Table 23 shows that the LP has the highest representation of women in district and municipal councils on country.
Table 23. Percent of female municipal and district councillors of every party
Distribution on education criterion
As approximately 90 percent of councillors had studied in the soviet period like mayors, their distribution on education criterion indicates a certain reality linked to the economic profile and staff training policies from the period concerned. Table 24 compared with Table 9 indicates certain differences in distribution of councillors and mayors on education criterion, and this fact can be intuited rather than established on basis of clear data. A comparison of data on education and occupation may give a more credible explanation and this will be done in the column regarding distribution on occupation criterion (Table 26).
Table 24. Distribution of municipal and district councillors on education criterion
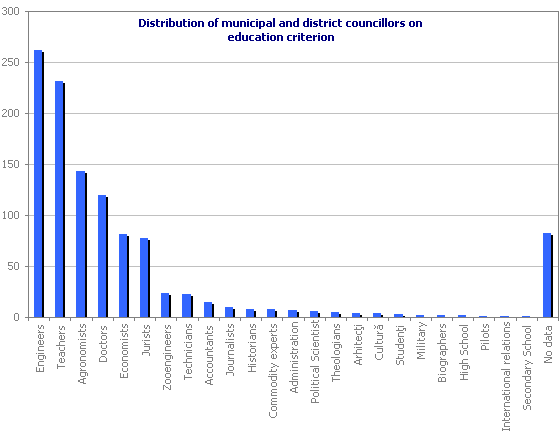
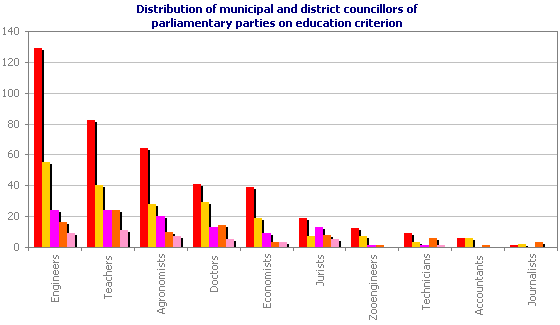
Table 25 confirms that the representation of councillors on education criteria like of mayors is uniform for the main political parties represented in Parliament.
Table 25. Distribution of municipal and district councillors of parliamentary parties on education criterion
Distribution on occupation criterion
Table 26 reveals the categories of politically and administratively active citizens in the light of basic occupation. The fact that entrepreneurs are represented most in local public administration bodies is not new, and this thing was also observed after the May 2003 local elections. If acknowledging that the “statistic” norm accordingly to which 5–7 percent of citizens are entrepreneurs is applicable in Moldova as well, their 24 percent representation in local councils, which means a four-fold rise, is a phenomenon worthy of attention and analysis.
Table 26. Distribution of municipal and district councillors on profession
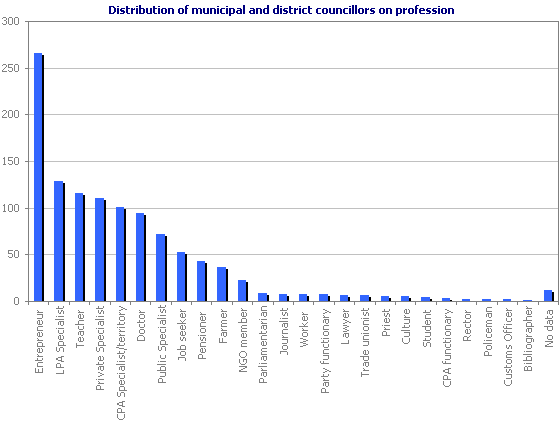
This phenomenon is one of most remarkable effects of the transition period. In all likelihood, the most active and skilful citizens had started up business in the period concerned, but the most significant segment of entrepreneurs was made of engineers because of deindustrialisation of Moldova. An explanation in this respect would be that health and educational institutions had subsisted somehow in the most difficult times, that is why doctors and teaches kept their jobs while engineers lost them very quickly, being forced by circumstances to adapt themselves to the new conditions.
So, the conclusion is that the overrepresentation of entrepreneurs and engineers in local administration councils is justified somehow. However, there are more prosaic reasons for overrepresentation of entrepreneurs in local administration councils. Entrepreneurs finance their electoral campaigns alone and they probably offer larger support to their parties. It is not an occurrence that businessmen choose to be elected in representative bodies when the financing of parties and electoral campaigns is not regulated adequately and financial control bodies manifest an excessive zeal towards the business willing to fund opposition parties.
Businessmen are also overrepresented among mayors. Table 12 hides the true number of businessmen elected mayors, as the relative majority of nearly 50 percent of mayors who have recently been re-elected came from business sector before their first election in 2003.
Table 27 reveals the distribution of councillors representing parliamentary parties on occupation criterion. Curiously, the share of entrepreneurs in the PCRM exceeds the average for this category, as well as for the OMA and the DPM. In general, it is very curious that approximately 42 percent of all business councillors are elected on behalf of the PCRM. In this respect, the reciprocal post-election accusations of the ruling party and opposition parties regarding attempts “to bribe” certain independent councillors or representatives of small parties or even to convert political “enemies” in order to create majority coalitions in districts, are grounded. Councillors who are businessmen could have used such artifices for “efficiency” reasons, without consulting the party leaders. Anyway, the scandals related to the “purchase of votes” of councillors should fuel thoughts.
Table 27. Distribution of municipal and district councillors of parliamentary parties on occupation criterion
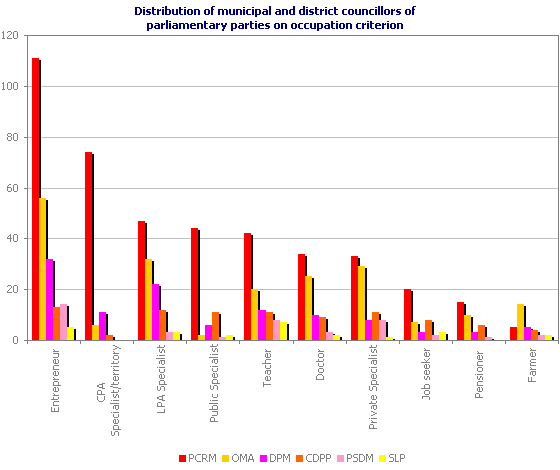
Table 27 shows that the PCRM is the main beneficiary of skills of specialists and public functionaries from de-concentrated services of central public administration (CPA) and probably of administrative resources. Anyway, decisions by the July 7 PCRM plenary session, obliging PCRM members elected in the public administration bodies, also confirms the danger of politicising the public administration.
Another fact worth to be mentioned is that teachers and doctors, particularly headmasters and directors of hospitals have a significant representation quota in district and municipal councils. The fact that the representation of teachers and doctors is proportional in terms of political affiliation indicates similar attitudes of influent political parties towards education and healthcare. However, if teachers are represented more or less uniformly among mayors and councillors, doctors are mainly represented among councillors, as this profession does not admit long interruptions imposed by the position of mayor.
Table 28 reveals the number of re-elected councillors of every political party.
Table 28. Number of re-elected municipal and district councilors
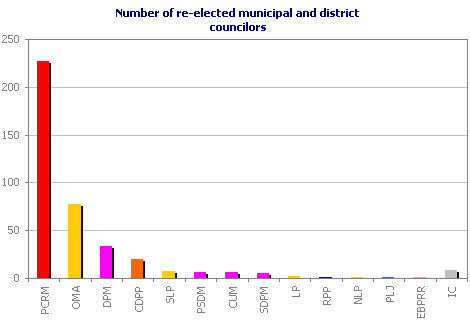
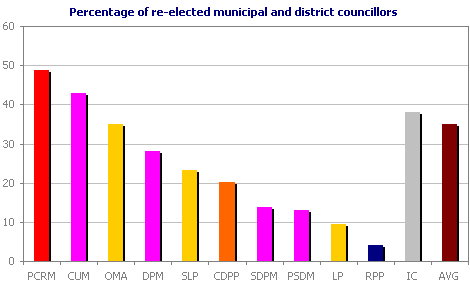
Table 29 reveals that the re-elected councillors count for approximately 35 percent and accordingly to previous data, this is typical both to local councils and to the Moldovan Parliament. Like in case of mayors, the PCRM has the highest percentage of re-elected councillors, but district democratic coalitions of other parties may compete with the PCRM regarding the previous experience of councillors.
Table 29. Percentage of re-elected municipal and district councillors
Political migration of councillors
The political migration of re-elected councillors allows a general estimation of the political migration phenomenon. Thus, 395 (35.2 percent) out of 1,122 councillors are re-elected councillors. The political migration among councillors was 14 percent, which is two-fold lower than of mayors. Mayors probably feel more the influence of competitive parties, particularly of the ruling party. As expected for councillors as well, the PCRM was the most active party to convert councillors of political opponents and independents. However, opposition parties, particularly the main rival of the Party of Communists, the OMA, cannot complain because they acted the same way.
If the mayors’ conversion proportion is 5:1 in favour of PCRM and in the detriment of OMA, in the case of councillors’ conversion the proportion is only 2:1 (see Table 30), and this corresponds exactly to the electoral rating of the PCRM and the OMA.
Table 30. Converted re-elected municipal and district councillors
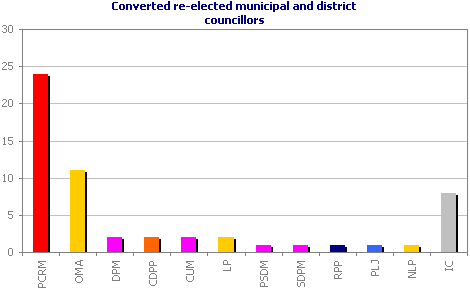
However, the OMA has a justification, as most of the converted councillors came from former members of the Democratic Moldova Bloc (DMB) — the SLP and the DP. Secondly, as observed in Table 31, the OMA has suffered the most from political conversions of councillors.
Nevertheless, proportions of political migration among councillors must not surprise. The political migration of district/municipal councillors is nothing but an echo of manoeuvres of coalition, merger and splitting of central party elites and that’s why central elites “reap what they seed.”
Table 31. Municipal and district councillors who migrated from indicated parties
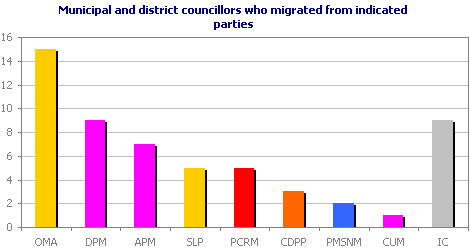
Table 32 provides complete information regarding the political migration of councillors. The number of re-elected councillors of every party is indicated on the diagonal at the intersection of the horizontal and vertical for each party. The number of councillors converted from every opponent party is indicated on the horizontal. The number of councillors lost by each party to opponents is indicated on the vertical.
Table 32. Converted district councillors
| PCRM | OMA | DPM | CDPP | PSDM | SDPM | RPP | CUM | LP | PLJ | NLP | EBPRR | IC | SLP | PMSNM | APM | Total | |
|---|---|---|---|---|---|---|---|---|---|---|---|---|---|---|---|---|---|
| PCRM | 227 | 8 | 4 | - | - | - | - | 1 | - | - | - | - | 4 | - | 1 | 6 | 24 |
| OMA | 2 | 77 | 3 | - | - | - | - | - | - | - | - | - | 2 | 4 | - | - | 11 |
| DPM | - | - | 33 | - | - | - | - | - | - | - | - | - | 1 | - | 1 | - | 2 |
| CDPP | - | 2 | - | 20 | - | - | - | - | - | - | - | - | - | - | - | - | 2 |
| PSDM | - | 1 | - | - | 6 | - | - | - | - | - | - | - | - | - | - | - | 1 |
| SDPM | - | - | 1 | - | - | 5 | - | - | - | - | - | - | - | - | - | - | 1 |
| RPP | - | 1 | - | - | - | - | 1 | - | - | - | - | - | - | - | - | - | 1 |
| CUM | 1 | 1 | - | - | - | - | - | 6 | - | - | - | - | - | - | - | - | 2 |
| LP | - | - | - | 1 | - | - | - | - | 2 | - | - | - | 1 | - | - | - | 2 |
| PLJ | - | - | - | 1 | - | - | - | - | - | 1 | - | - | - | - | - | - | 1 |
| NLP | - | - | - | - | - | - | - | - | - | - | 1 | - | 1 | - | - | - | 1 |
| EBPRR | - | - | - | - | - | - | - | - | - | - | - | 1 | - | - | - | - | 0 |
| IC | 2 | 2 | 1 | 1 | - | - | - | - | - | - | - | - | 8 | 1 | - | 1 | 8 |
| SLP | - | - | - | - | - | - | - | - | - | - | - | - | - | 7 | - | - | 0 |
| PMSNM | - | - | - | - | - | - | - | - | - | - | - | - | - | - | 0 | - | 0 |
| APM | - | - | - | - | - | - | - | - | - | - | - | - | - | - | - | 0 | 0 |
| Total | 5 | 15 | 9 | 3 | 0 | 0 | 0 | 1 | 0 | 0 | 0 | 0 | 9 | 5 | 2 | 7 | 56 |
Political profile of district/municipal administrations
The results of the June 3 and 17, 2007 local elections had an immediate impact on conduct of the main political parties. In this regard, the PCRM was the first party to comment the results of local elections at the July 7, 2007 plenary session, establishing its immediate priorities to prepare itself for the 2009 parliamentary elections. An unhidden objective voiced by President Voronin was formulated as a threat against districts ruled by opposition parties (district chairmen and deputy chairmen).
Table 33 highlights the political membership of district chairmen and Chisinau and Balti administrations. The PCRM exercises two kinds of pressures on opposition majority coalitions from districts and Chisinau municipality: financial pressures, which are clearly observed in the draft budget law for 2008, a document especially contested by the OMA, which rules a relative majority of districts; information pressures aimed to libel leaders of opposition parties, especially the LP leaders who rule the Chisinau municipality. It is true that leaders of opposition parties have provided lots of pretexts to be ridiculed by the PCRM propagandistic machine. If the opposition knew to learn from own mistakes and draw conclusions from what happened so that not to expose itself to the confusing propaganda of the PCRM (at least till the 2009 elections), it would be thankful to this propagandistic machine for starting its assaults now.
Table 33. Political membership of district chairmen and administrations of municipalities (Chisinau and Balti)
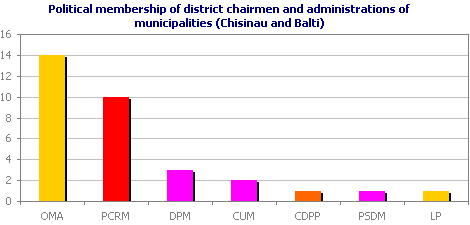
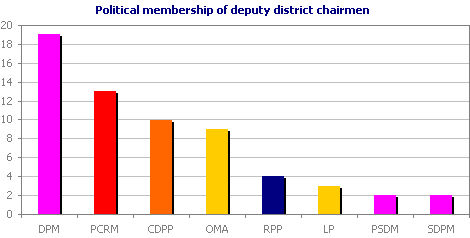
Table 34 reveals the distribution of offices of deputy district chairmen and deputy mayors of the Chisinau and Balti municipalities.
Table 34. Political membership of deputy district chairmen
Conclusions
The sociological profile of mayors and district/municipal councillors reveals that the representation of all important political parties in public administration bodies is generally more or less uniform in terms of education and occupation of local councillors. In this regard, one could say that the profile of the largest and most active segment of political parties represented in public administration bodies is irrelevant for the Moldovan political cleavage. The social status determined by education and occupation of representatives of political parties does not substantiate the pretensions to represent some social levels with certain specifics.
The essential differences in representation of parties in local public administration bodies envisage the age and the gender. However, comparisons reveal the positive role of parties in reducing the disequilibrium. The distribution of independent mayors and councillors on diverse criteria is a reference point for these comparisons. Given the fact that approximately 52 percent of the voters are women and approximately 40 percent are citizens between 20 and 39 years old, these categories are represented 8 and 4 percent in case of independent councillors, compared with the average of 16.5 percent and 8 percent. The situation is different as regards mayors. The representation of women and persons between 20 and 39 years old is as follows: 15 percent and 18 percent for independents, compared with the average of 18 percent and 15 percent. Youths promotes themselves easier to the mayoral position than via parties.
Entrepreneurs in Moldova represent the most active political segment, being represented by approximately ¼ of district/municipal councils. Of course, these are representatives of small and medium businesses made of managers of limited societies, joint stock societies and individual enterprises. This would be a very encouraging conclusion if the Moldovan political culture allowed a clear delimitation of the private and public interest. However, there are clear signals that the business joins the politics to protect itself against pressures rather than because it is aware of its role in society. As the activeness and capacities of businessmen exceed the statistic average, the Moldovan political scene may change much very soon.
The example of small and medium business representatives may encourage the big business, which could get involved with social projects after the 2009 parliamentary elections. The approach of political problems is typical to businessmen, given the risk distribution criterion. It is logical to distribute the “political eggs” to other baskets as well, not only to the one of the ruling party. That’s why investments in new social democratic, liberal, etc., projects are expected. This is expected including because the politics has become the most profitable business at the current development stage of the Republic of Moldova. This conclusion is effective both for Moldova and for all states in transition.
Mergers, coalitions and political migration will further persist until the 2009 parliamentary elections, as the uniformity of parties’ representation on occupation of their members allows slight jumps over doctrinaire and ideological barriers. In spite of uniformity of representatives of main political parties, doctrines and ideologies of Moldovan parties remain important to strengthen the leadership of parties and to assimilate the experience and elaborations of “internationals” built on basis of doctrines.
The uniformity of parties’ representation on education and occupation of their members suggests that once they are elected to rule the country or municipalities, parties will be lured to promote policies dictated by circumstances rather than by supported doctrines and ideologies. A confirmation in this respect is the fact that the PCRM does not scruple to state that it promotes “liberal reforms in economy” in spite of its communist doctrine based on the “Marxist-Leninist theory,” while the LP says after having gained the power in the Chisinau municipality that it has to reconsider the social policies in order to protect the socially vulnerable levels. For this reason, arguments that an eventual coalition or merger of social democratic parties with social liberal parties, etc. would be unnatural do not resist. The invoked “uniformity” is also clear because electoral offers of majority of political parties are amazingly similar in spite of doctrinaire differences. Under these circumstances, in order to raise electoral profit, the main political parties polarise the public opinion on more sensitive criteria than the doctrinaire ones, such as: linguistic, ethnic identity, interpretation of history, with the purpose to suggest visions for an eventual future. Political scandals that have already started from perspective of the 2009 parliamentary elections are another source to polarise opinions in a relatively uniform space.
Besides multiple organisational and media advantages, the PCRM is very advantaged by experience of its representatives in public administration. In contrast, the opposition could face soon a very unpleasant fact with a huge propagandistic potential. Knowing how hard opposition political parties have negotiated major coalitions in districts, including to influence the election of district chairmen and deputy chairmen, it is strange that they did not work to confederate or at least to inform the public opinion over preparation of new elections for the Rezina district council, elected on June 3, 2007 but dissolved because democratic parties could not ensure at three consecutive sittings the necessary quorum to demonstrate the functionality. The opposition would need very much a victory at the November 11 elections in order to influence the public opinion, so that to provide an incontestable confirmation of the trend of unrecoverable decline of the PCRM. The way the opposition has prepared itself for the Rezina elections does not inspire confidence that it realised the importance of the victory. The PCRM has truly avoided talks on election of the Rezina district council, with the probable purpose not to remind the public opinion that the boycott of the PCRM was one of indispensable elements to dissolve the district council and waste public funds. However, the goal of the PCRM is understandable — to undermine the opposition and to win the November 11 new district elections. The recent visit of President Voronin to the Rezina district and the suggestion to electors that those they vote on June 3 do not understand what value they promote are not occurrences. If the PCRM wins the Rezina elections, the media-holding affiliated to PCRM will have an amazing propagandistic topic to suggest citizens what may happen at the 2009 parliamentary elections. Even more, an eventual victory of the PCRM in Rezina will answer what would have happened at the early parliamentary elections, if the opposition had blocked the April 4, 2005 election of the president.
- ↑ Data from Tables 1 and 2 were taken from the May 2007 Public Opinion Barometer, www.ipp.md