ADEPT | Gagauzia 2016 | Presidential 2016 | Elections 2015 | Bashkan 2015 | Gagauzia 2012 | Political Parties
Economic Policies on April 2–15, 2011
 |
 |
e-journal #166 |
Prices and inflation
For T1’2011 prices rose by 3.3%…
According to NBS data in March the consumer price index (CPI), compared to February 2011, was 100.8%, and compared to March 2010 — 105.8%.Since the beginning of the year (in March this year compared to December 2010) the prices increased by 3.3%, so the inflation rate for the first three months exceeded 3%. The increase of average consumer prices in March compared to this February was caused by higher food prices — by 0.7%, non-food — by 0.3% and tariffs for public services supply — by 1.7%.During the analysed period significant increases of food prices have been recorded for: sugar — by over 12%, fresh vegetables — by about 2% fresh fruits — by 1.5% (including apple — by 2.5%), bread and vegetable oil — by more than 1%.For non-food products the most visible price increases were for auto-transport fuels — over 4%, construction materials — by 2.5%. The services rendered to the population in the reported month recorded a higher tariff: housing maintenance services — by more than 3%, payment for maintenance and education of children in kindergarten — by about 3%, catering services — by about 2%.At the same time, it should be noted that in the reported month the prices have fallen for eggs, mutton and pork meet, fresh and frozen fish. However, this is due to the Easter fasting period, which caused also lower prices for meat products.
Foreign trade
The share of Moldovan exports to the EU is about 52% out of total…
According to the same NBS data exports of goods in February 2011 amounted to USD 161.2 million, with about 20% more than in the previous month and by about 50% — compared with February 2010.In January-February 2011 the exports totalled almost USD 296 million, the volume that is higher than that achieved in the corresponding period in 2010 with over 56%. Exports of goods to the EU countries (EU-27) totalled 153.5 million dollars (over 54% more than in January-February 2010), which is about 52% of total exports (about 53% in January -February 2010).CIS countries were present in Moldovan exports with a share of 33.6% (January-February 2010 — 37.0%), which corresponds to over USD 99 millions. Exports of goods to these countries rose by about 42% compared with January-February 2010.
Imports of goods made in February 2011 have totalled approximately USD 357 millions, by about 25% more than in the previous month and by about 42% — compared with February 2010. Imports in January-February 2011 totalled nearly USD 642 millions, the volume that is higher by 42% than that achieved in the corresponding period of previous year. Imports from European Union countries (EU-27) amounted to approximately USD 247 millions (with about 46% more than in January-February 2010), which is a share of more than 38% of total imports (37.5% in January-February 2010).Imports of goods from CIS countries amounted to over USD 255 millions (by about 39% higher than in January-February 2010), which equals about 40% share in total imports (about 41% in January- February 2010). Significant difference in the evolution of exports and imports led to the accumulation in January-February 2011 of a trade deficit worth USD 346 millions, with over 84 millions (32%) higher than that registered in January-February 2010.
Wages and income
The income of population in 2010 rose by just 1.7% in real terms…
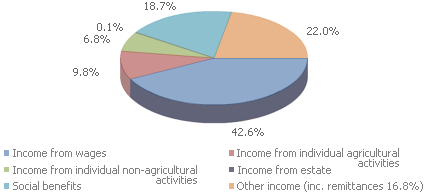
Statistics show that in 2010 the population’s disposable income were in average per person about MDL 1274 lei per month, that is higher by 9% comparative to the previous year. In real terms (adjusted to consumer price index) the income of population grew by only 1.7%. Wage payments are the most important source of income by over 42% of total available revenues, their contribution being decreasing compared to the year 2009 by 2.7 percentage points. Social benefits are the second important source of income, contributed to household income at a rate of about 19% or 1.2 points higher than in 2009. Revenues achieved by individual agricultural activity constitutes about 10% of total disposable income (+1 percentage point compared to 2009), and those of individual non-agricultural activities — 6.8% (+0.3 p.p.). Money transfers from abroad (remittances) remain an important source of household income formation, their contribution being almost 17% out of total revenues.
Figure 1. Structure of total disposable income in 2010
The average monthly consumption expenditures of the population in 2010 were in average MDL 1,372 per person per month, increasing by about 13% compared to the previous year. In real terms (adjusted to consumer price index) the population spent in average by 5% more compared with 2009. Most traditional expenditure remains that for food consumption — about 41% (same as previous year). To maintain a flat a person in average spent about 18% of total consumption expenditures, while for clothing and footwear — almost 11%. Other expenditures were for health 6.4%, transportation 5%, communications 4.6%, housing provision 4%, and education 1.3% etc.
Archive
2011 2010 2009 2008 2007 2006 2005 2004 |