ADEPT | Gagauzia 2016 | Presidential 2016 | Elections 2015 | Bashkan 2015 | Gagauzia 2012 | Political Parties
Economic Policies on July 1–15, 2011
 |
 |
e-journal #172 |
Prices and inflation
Inflation falls down to likely reasonable 5-percent rate in first half of this year…
According to the National Bureau for Statistics (NBS), the Consumer Price Index (CPI) in June was 100.1 percent compared with May 2011 and 107.7 percent compared with June 2010 (for information, CPI was 99.5 percent in June 2010 compared with May 2010 and 107.8 percent compared with June 2009). Consumer prices rose by 5 percent this year (in June 2011 compared with December 2010). Average consumer prices increased in June compared with May, as prices of foodstuffs rose by 0.4 percent and tariffs for public services advanced by 0.1 percent.
Prices of most of manufactured goods were constant in the period concerned. Prices of fuels decreased by 1.1 percent (including bottled liquid gas by 6 percent and fuels by 0.2 percent), while prices of ready-made clothes, information processing devices, mobile telephony devices and some household appliances dropped by 0.3 percent each. Tariffs for following public services increased in June: interstate passenger railway transport by 5.3 percent, air passenger transport by 1.3 percent, and public food services provided by taverns by 1 percent.
Labour market
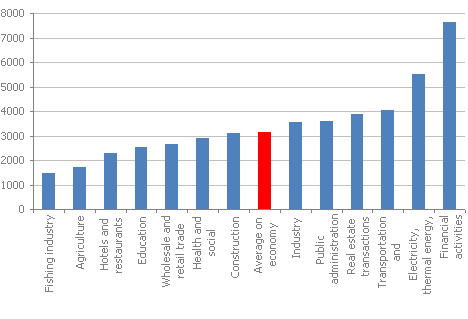
Heavy money goes to financial activities, while agriculture makes little do…
Statistics reveal an average gross nominal salary of about 3,135 Moldovan lei (MDL, about 269 dollars) for April 2011, and increased by nearly 14 percent compared with April 2010 and by 5 percent compared with March 2011. The real wage increased by 6.8 percent in April 2011 compared with April 2010. Medium nominal salary in budgetary sector was more than 2,743 MDL (and increased by 11.6 percent compared with April 2010). Average wage in real sector of economy accounted for 3,319.1 MDL in April (by 14.6 percent more than in April 2010).
Average gross salary in April 2011, thousand MDL
Methodological changes to calculate salaries…
NBS modified the wage calculation methodology starting January 2011. Statistics concerning salary earnings are based on a new selective statistical research called Short-term statistical indicators implemented by national statistics accordingly to European norms[1]. The research echelon covers about 10,500 social-economic units and is representative at national level alone. The research covers budgetary units (public administration, education, healthcare and social assistance, etc.) in an exhaustive manner. The research covers units with at least 4 salary-earners in real sector of economy, which means more than 92 percent of overall employees in this sector. It covers economic units with at least 20 employees in an exhaustive manner and surveys those with 4–19 employees.
As well, starting this year the centralisation of accounts afferent to short-term statistics on salary earnings is based on similar activity (except for economic units with maximum 49 employees), unlike precedent years when the centralisation of data on all economic-social facilities was based on main activity of reporting units.
NBS notes that starting January 2011, like in other developed countries particularly in the EU, reporting units do not provide any longer cumulative data “since the beginning of the year” but only current data for “the month concerned”. Therefore, the data are disseminated separately on the period concerned (here on months).
Foreign trade
Exports give lead to economic growth…
Exports of goods and products made in Moldova amounted to 828 million dollars in January-May 2011, by 63 percent more than in the similar period of 2010. Commodity exports to the European Union (EU-27) were worth about 416 million dollars (by 67 percent more than in January-May 2010), covering more than half of overall supplies (49 percent in January-May 2010). The CIS absorbed more than 38 percent of Moldovan exports (about 39 percent in January-May 2010), which is equivalent to over 316 million dollars. Exports of goods to this area rose by more than 61 percent compared with January-May 2010.
Supplies of manufactured goods ranked the 1st place and covered more than 23 percent of overall exports. Important shares were recorded by exports of clothes and items, furniture and items, and footwear; that mean production manufactured by joint enterprises which export in lohn. Exports of food products and living animals ranked the 2nd place, representing more than 17 percent of overall value of exports. Exports of engines and appliances ranked the 3rd place with more than 13 percent of overall supplies, and exports of drinks and tobacco ranked the 5th place with more than 9 percent of overall supplies.
Imports turned over about 1,958 billion dollars in January-May 2011, by nearly 45 percent more than in the similar period of last year. Imports from the European Union (EU-27) exceeded 855 million dollars (by about 45 percent more than in January-May 2010), which is nearly 44 percent of overall imports (43.6 percent in January-May 2010). Imports from the CIS area were worth more than 659 million dollars (by about 44 percent more than in January-May 2010), which is equivalent to 33.7 percent of all imports (33.9 percent in January-May 2010).
Imports of mineral fuels, lubricants and items covered 23 percent of overall imports. Oil and oil products covered 49 percent of imports in this area and more than 11 percent of all imports, while gas and industrial products made from gas got 46.6 percent and 10.7 percent respectively. Imports of engines and items covered 21.5 percent of all imports. Manufactured goods grouped on raw materials covered more than 18 percent of all imports, with fibres, fabrics and textiles being leaders. Imports of chemical products and items represented 13.5 percent of all imports, and imports of foodstuffs and living animals covered 10 percent of the overall. The gap between exports and imports fuelled a trade balance deficit of about 1.13 billion dollars in January-May 2011.
- ↑ The term “salary earning” is equivalent to “medium salary”
Archive
2011 2010 2009 2008 2007 2006 2005 2004 |